Anthropic’s latest release Interactive visual for Claude at first glance, it looked like the next incremental update in the AI race. When this feature was first introduced a month ago, I didn’t think much of it. After all, LLMs were “visual” for a while, so it didn’t feel particularly groundbreaking.
It wasn’t until I started using this feature to read I realized how invaluable it can be. The new Sonnet 4.6 model can transform static explanations into interactive and responsive visuals, and I can’t think of a better use for learning and development. After using the feature for a little over a week, it’s quite difficult to go back to static books to understand complex principles, and so far it feels like interactive feedback was the missing link for digital learning.
Math is finally digestible
At least it’s 3D geometry

I’ve always been a relatively slow learner when it comes to math, and for a long time I couldn’t understand why. Part of the problem is now apparent. Textbooks and online course materials often rely on two-dimensional images to explain (often clumsily) three-dimensional concepts, and trying to extrapolate depth and rotation from static diagrams always distracts from the problem itself. As you can probably guess, this has made 3D geometry a particularly interesting topic. Even looking at solutions didn’t help much at all.
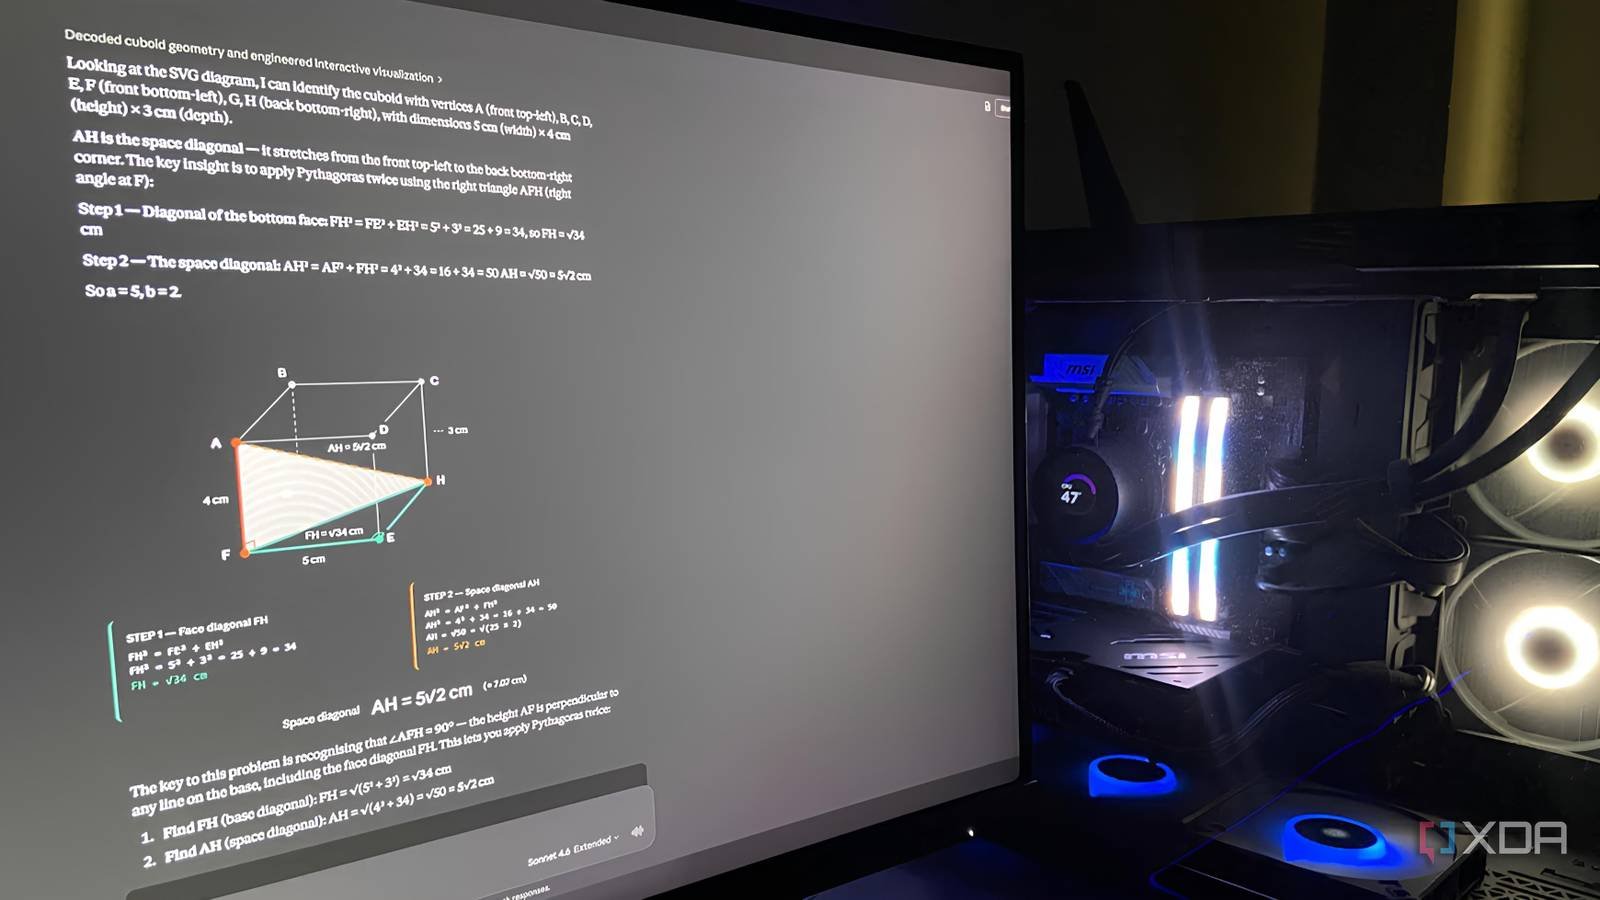
When it comes to solving these problems and understanding the solution, interactive visuals have been nothing short of a godsend. I tried it Sonnet 4.6 model with a basic 3D geometry problem where I have to calculate the space diagonal of a cuboid. The model took about a minute to create an interactive figure that colored the triangle, and it immediately dawned on me that the problem required two consecutive applications of the Pythagorean theorem, just by looking at the figure and hovering my mouse over it.
Interactive circuits change everything
Physics is best understood through interaction

I’ve probably spent more time trying to understand diagrammatic representations of logic gates and analyze them through truth tables than anyone else. Most tutorials will present them as binary abstractions and leave it entirely up to you to manually keep track of the 1s and 0s. It helps, but it also definitely adds some cognitive load to the process.
I did not feel this cognitive burden when I asked Claude to explain the formation and operation of AND, NOT, and OR gates. The model created well-labeled gates with simple toggle switches that instantly change the state of the circuit. Wires would burn, states would change, and I no longer had to calculate the behavior of each gate against the table to see what the result would be.
It occurred to me that even the best online resources don’t do this and instead revert to the same, more uninspired PDFs. While it’s true that there are certain dedicated circuit simulators that exist for this exact purpose, it’s also true that the friction of switching from one context to another is often too high for most users. With these tools available, how often does one actually look for specific software? Available locally within LLMs we already use it for almost everything?

It can bring your schematic diagrams to life
Seeing everything in action everything to make sense

One of the problems I usually encounter when studying textbooks is how schematic diagrams designed to represent motion remain static, while the reader must mentally simulate multiple aspects such as the direction of motion, its frequency, and how the entire system fits together. This, to me, distracts from the main principle I’m particularly trying to understand, and nowhere is this phenomenon more apparent than in subjects like kinematics. I usually have to make sense of the formula and the flat representation of the circles and gears, and the resulting conceptual clarity takes longer.
Out of sheer curiosity, I decided to take one of these diagrams to Clo and was pleasantly surprised to see that he was able to create an interactive model simulating gear ratios from a static image. Tuning, tuning and observing the system in action allowed me to understand a concept that would have easily taken almost an hour on YouTube videos.
Is there a natural evolution in learning?
A few years ago, if I had been asked how LLMs could fit into learning, I would probably have limited the perspective to ChatGPT Explains concepts like “I was five years old” or maybe Grok pulls out last minute essays. Claude’s interactive visuals feel like a real breakthrough in how everything is explained and understood.
There is a small caveat though. The visuals on the free tier are quite expensive and I was only able to manage a few before hitting the limit. This can prevent more casual users.

- OS
-
Windows, macOS
- Individual price
-
A free plan is available; $17/month Pro plan
Claude is an AI assistant and LLM developed by Anthropic.